

Invisible Wires: Agentic Cloud
Less Talk, More Rock!
First published on Medium on July 15, 2026. Reposted here so it lives alongside the rest of the lab notes. It follows an earlier piece, In walked a Mermaid diagram.

I posted a while ago on using NotebookLM and Gemini to create live and version controlled diagrams representing Nutanix Cloud Clusters and the platform ecosystem Nutanix has brought to market: In walked a Mermaid diagram.
Let's dive in a bit deeper today. Nutanix is a platform and a software company. We have a large ecosystem with many vendors and partners. From our "About Us" at www.nutanix.com:
The rise of AI and cloud native technologies combined with an explosion of apps and data across increasingly distributed hybrid environments have made IT infinitely more complex.
Nutanix helps you simplify your IT infrastructure with one platform to run apps, data, and AI anywhere — in public and private clouds, datacenters, on-premises and at the edge.
With Nutanix, you have the freedom to choose your servers, storage, clouds, GenAI models, Kubernetes platform, developer toolchain, policies, and more to meet your business needs today and tomorrow.
What's that mean? A lot of choices. A lot of technology partner(s). GSI, manufacturers, ISVs, open source, Cloud, GPU, and all workloads.
Putting together a cohesive logical diagram is always possible but I am not interested in the art of possible. I have done the GitOps approach to running documentation through a GitOps pipeline. I have participated in countless "template" exercises and can recall a time during an interview where I reverted to a 18x24 sheet of paper to create a logical diagram of a software defined datacenter. I am also not looking for an ADR, I am a hybrid multi cloud architect and quite frankly, I need to do a lot.
What I need to do more than anything is show a packet and its path from source to destination. I need something highly flexible and lightweight.
For me, markdown, JSON and plaintext all work wonderfully for highly flexible and lightweight. PlantUML is a meh for me. I don't want to manage images. Less is more in my world.
So here is a common scenario I have seen play out over the last few months. I am protecting the name(s) of the innocent here. With the advent of CoPilot and ChatGPT I get a new paradigm where decision makers and influencers use these tools in real time to try and validate if what we are saying is true. I get it. You want to empower yourself. However, under the hood that LLM or vLLM was trained on a dataset with a time stamp next to it. They will hallucinate. Point being here, many times I need to create a diagram on the fly. When I say on the fly, I mean in less than 5 min. And I need the diagram to be accurate and reflect a story of truth about a packet and its path to its destination.
The only thing I care about in this journey is telling the story correctly (validated), understanding when and where the story changed (version control) and where does it live (I want to refer to it quickly — not in an image gallery).
I do run a personal agentic lab at home; this write-up is using corporate available tools and falling within the Nutanix policy of AI fair use.
With all that said, Mermaid diagrams offer me the most flexibility while maintaining flexibility and lightweight.
The stack
For Mermaid diagrams, the underlying format is a markdown-like plain text… let's dive a bit deeper into the stack. Mermaid JS (hint) is all about transforming a few lines of plain text into beautiful, interactive diagrams right on a web page! There are basically 4 parts to this stack.
- [ Plain Text Input ] ➔ [ Parser / AST ] ➔ [ Layout Engine ] ➔ [ SVG Render (D3.js) ] — First, Mermaid reads the raw text string. It uses a parser to scan the text and break it into meaningful "tokens." Yikes! Not those tokens!
- Building the Blueprint (Abstract Syntax Tree) — Once parsed, the data is organized into an Abstract Syntax Tree (AST) or a structured logical graph object. At this stage, the computer understands the relationships (e.g., "Node A connects to Node B"), but it has absolutely no idea where to place them visually on the screen.
- The Layout Engine (The Geometer) — This is where the heavy mathematical lifting happens. Mermaid passes the logical graph to a layout engine (such as dagre for standard charts or elkjs for complex architectures). The layout engine runs graph-distribution algorithms to calculate the exact coordinate points (x, y) for every node, bounding box, text label, and arrow path so that they don't overlap awkwardly and are easy for humans to read.
- Rendering (The Digital Painter) — With coordinates in hand, Mermaid hands the data over to D3.js (a powerful JavaScript visualization library). D3 binds this mathematical data to the webpage's Document Object Model (DOM) and draws standard SVG (Scalable Vector Graphics) elements — like
<rect>for boxes,<path>for arrows, and<text>for labels.
The scenario
Let's set some context:
Customer A is looking to migrate into Nutanix Cloud Clusters on Azure. They want a perimeter firewall and Layer 4–7 inspection on user workloads.
As a first pass, I want to ensure I have a baseline architecture that can be iterated on rapidly.
Gemini is pretty great. I am working in Gemini directly but I also have gems that act as Nutanix SMEs. In this case, I used Gemini directly so most should be able to reproduce themselves.
Here is my prompt and it's basic as intended. I only care about the output which is my first version.
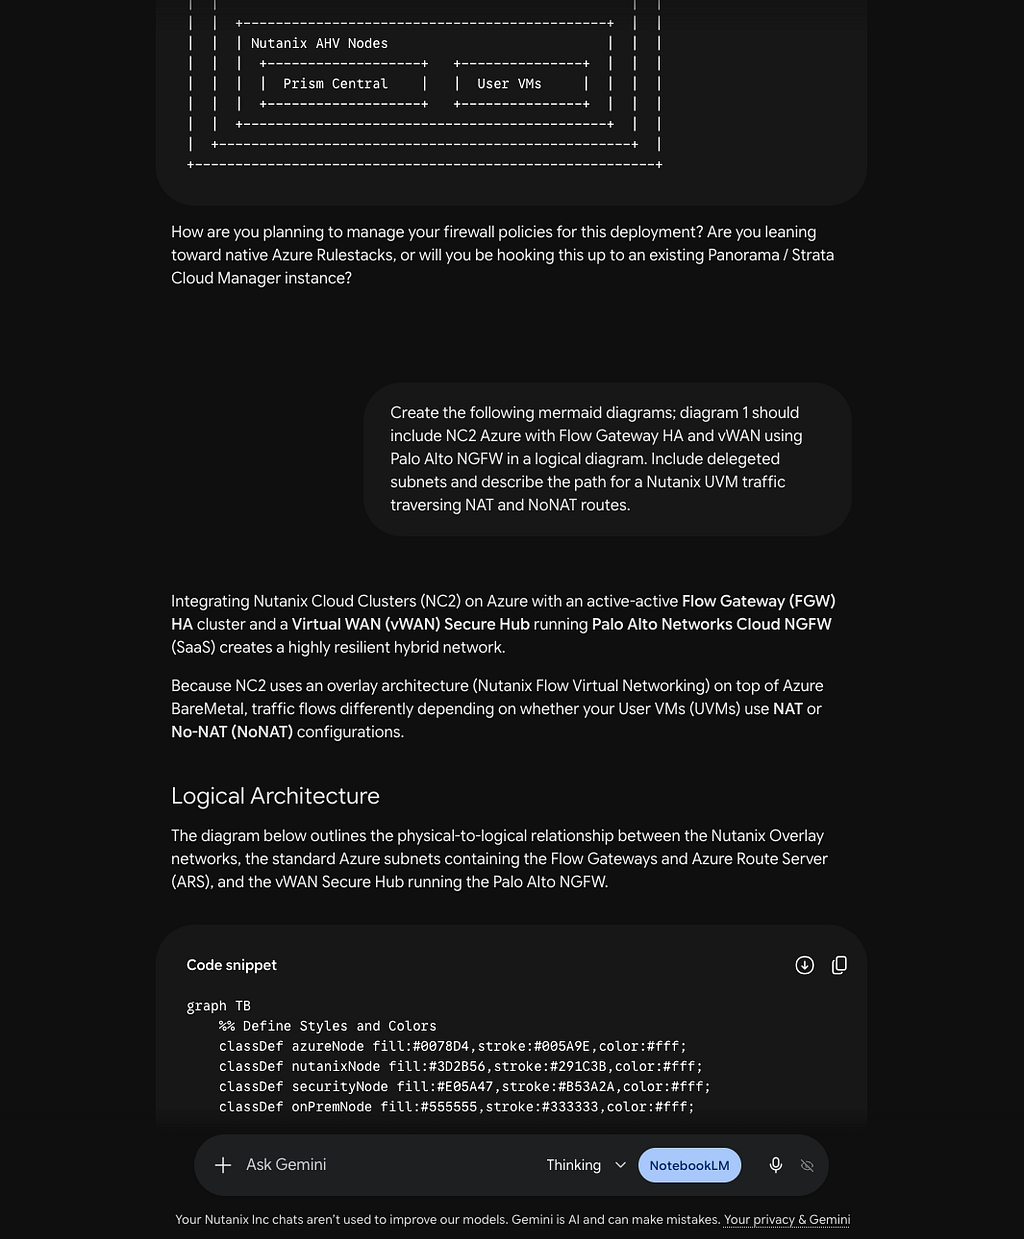
You can see the basic prompt: "Create the following mermaid diagram; diagram1 should include NC2 Azure with Flow Gateway HA and vWAN using PAN NGFW SaaS Subscription in the diagram. Include the Nutanix delegated subnets and describe the path for a Nutanix UVM (User VM) traffic traversing NAT and/or NoNAT configurations."
What is nice about this approach is I get a logical diagram WITH the context (see below).
graph TB
  %% Define Styles and Colors
  classDef azureNode fill:#0078D4,stroke:#005A9E,color:#fff;
  classDef nutanixNode fill:#3D2B56,stroke:#291C3B,color:#fff;
  classDef securityNode fill:#E05A47,stroke:#B53A2A,color:#fff;
  classDef onPremNode fill:#555555,stroke:#333333,color:#fff;

  %% On-Premises Segment
  subgraph OnPrem [On-Premises Corporate Network]
    OP_Router[ExpressRoute/VPN Customer Gateway]
    OP_Client[On-Premises Client <br> 192.168.1.100]
    OP_Client <--> OP_Router
  end
  class OnPrem,OP_Router,OP_Client onPremNode;

  %% Azure Virtual WAN Hub
  subgraph vWAN [Azure vWAN Secure Hub]
    vHub_Router[Virtual Hub Router]
    Palo_SaaS[Palo Alto Cloud NGFW <br> (Secure Hub NVA)]
    vHub_Router <--> Palo_SaaS
  end
  class vWAN,vHub_Router azureNode;
  class Palo_SaaS securityNode;

  %% Native Azure VNet
  subgraph Native_VNet [Native Azure Spoke VNet]
    Native_VM[Azure VM / App <br> 10.20.1.50]
  end
  class Native_VNet,Native_VM azureNode;

  %% NC2 on Azure VNet
  subgraph NC2_VNet [NC2 on Azure VNet]

    %% Delegated Subnet for Nutanix BareMetal Nodes
    subgraph Delegated_Subnet [BareMetal Delegated Subnet]
      AHV[Nutanix AHV Hypervisor]
      CVM[Controller VM (CVM)]
    end

    %% Standard Azure Subnets
    subgraph Native_Subnets [Standard Azure Subnets]
      ARS[Azure Route Server]

      subgraph FGW_HA [Flow Gateway HA Cluster]
        FGW_1[Flow Gateway 1 <br> (Active)]
        FGW_2[Flow Gateway 2 <br> (Standby)]
      end
    end

    %% Overlay networks managed by Flow Virtual Networking
    subgraph Flow_Overlay [Nutanix Flow Virtual Networking]
      Transit_VPC[Transit VPC]

      subgraph User_VPCs [User VPCs]
        UVM_NAT[UVM — NAT Subnet <br> Overlay: 10.100.10.10]
        UVM_NoNAT[UVM — No-NAT Subnet <br> Overlay: 10.100.20.20]
      end
    end

  end
  class NC2_VNet,Delegated_Subnet,AHV,CVM,Native_Subnets,ARS,FGW_HA,FGW_1,FGW_2 azureNode;
  class Flow_Overlay,Transit_VPC,User_VPCs,UVM_NAT,UVM_NoNAT nutanixNode;

  %% Edge Connections / WAN Peerings
  OP_Router <==|ExpressRoute / S2S VPN|==> vHub_Router
  vHub_Router <==|VNet Connection|==> NC2_VNet
  vHub_Router <==|VNet Connection|==> Native_VNet

  %% Traffic Routing inside NC2
  UVM_NAT -->|Overlay Route| Transit_VPC
  UVM_NoNAT -->|Overlay Route| Transit_VPC

  Transit_VPC <-->|Geneve/VXLAN Tunnel| FGW_1
  Transit_VPC <-->|Geneve/VXLAN Tunnel| FGW_2

  %% BGP Peering for Route Propagation
  FGW_1 <-->|BGP Peer| ARS
  FGW_2 <-->|BGP Peer| ARS
  ARS -.->|Propagates Overlay Routes <br> to Next-Hop FGWs| vHub_Router
That's it, that's the lightweight payload I need, easy to copy pasta and your version control becomes your Gemini history or (in my case) I turn it into a notebook to ensure I have isolation in the prompt history and can continue building off of that narrative, wherever it was left. The Google NotebookLM becomes the ADR — your source of truth.
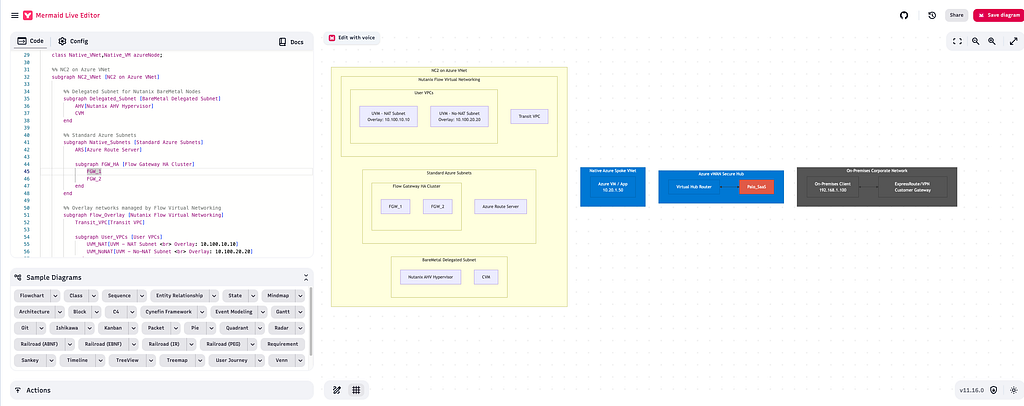
I dragged the mermaid diagram into Mermaid.live here www.mermaid.live and the ONLY reason I chose it is lack of adware and the old "free" incentive.
Here is the end-state — and more than ready to tell a story about a packet reaching its destination!
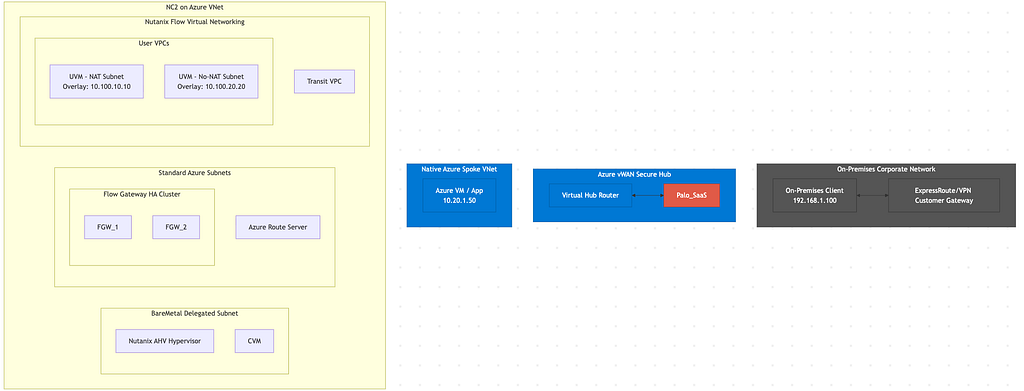
What are you doing today for ADR and logical diagrams to help tell stories?
Originally published on Medium, July 15, 2026. Reposted with light typo fixes, section headings for navigation, and the Mermaid arrows restored to their plain-text form (<-->, -->) where Medium's editor had turned them into symbols — the block above pastes straight into mermaid.live.
Find me on LinkedIn.
Follow along
Get the next post without leaving this page: copy the feed into any reader, or get it by email. Live builds and the lab's music stream on Twitch.
Comments